

HubSpot reporting can show a B2B team where enquiries become qualified opportunities, where deals stall and which activities are associated with won revenue. But a dashboard cannot settle disagreements about what counts as a qualified lead, an active deal or a reliable forecast. I recommend agreeing on those definitions first, then building reports around the decisions leaders and teams actually need to make.
For companies in Dubai, the UAE and the wider GCC, that discipline matters when marketing and sales teams cover different markets, languages, business lines or buying committees. This guide gives you a practical way to define your funnel, select HubSpot reports, test the underlying data and turn the result into a weekly operating rhythm.
Index: HubSpot reporting topics
- Why B2B reporting starts with definitions
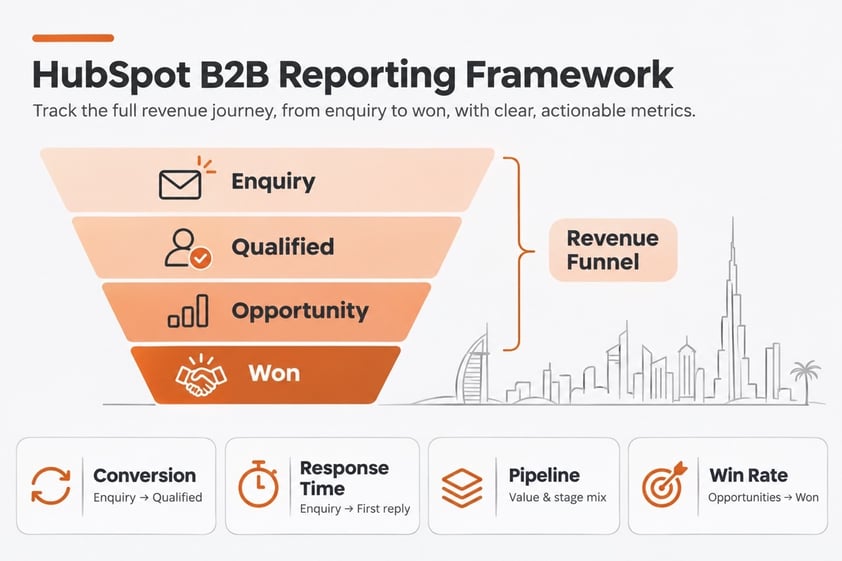
- Which B2B funnel metrics to track
- A practical metric dictionary
- Which HubSpot reports to use
- How to build a useful dashboard
- How to interpret attribution and revenue
- Data checks and common reporting traps
- UAE and GCC reporting considerations
- Frequently asked questions
Why B2B HubSpot reporting starts with definitions
A CRM report counts what the CRM records. If one salesperson marks a deal qualified after a discovery call while another waits for confirmed budget, the same funnel chart will combine different meanings. That is a process problem before it is a dashboard problem.
There is also a business reason to connect the numbers across channels. McKinsey’s 2026 Global B2B Pulse Survey drew on nearly 4,000 decision-makers in 13 countries and found that buyers use an average of ten touchpoints across their purchasing journey. The finding is global, not a UAE-specific benchmark, but it is a useful reminder that a single last-click source rarely describes a complex B2B decision on its own. [McKinsey, 2026 Global B2B Pulse]
For a UAE technology consultancy, for example, a buyer may first read a guide, attend a webinar, speak to a partner, return through branded search and then meet a consultant. Reporting should preserve the signals you can verify without pretending that a model assigns perfect causal credit.
Before building reports, agree on these basics:
- Stages: What observable event moves a record into each lifecycle or deal stage?
- Qualification: What evidence makes an enquiry marketing-qualified, sales-qualified or a real opportunity?
- Ownership: Which team or owner is accountable for the next action?
- Time: Which date starts the measurement window: first conversion, stage entry, deal creation or close?
- Currency and scope: Are amounts reported in AED, converted consistently, and filtered to the same business unit, pipeline and market?
Which B2B funnel metrics should HubSpot reporting track?
Track a small set that follows the commercial journey. Choose metrics according to your sales motion; a short-cycle inbound service team and a multi-month enterprise consultancy do not need identical dashboards.
- Enquiry volume and source: New contacts or enquiries by source, market and campaign.
- Qualification rate: Qualified records divided by the eligible enquiries created in the same cohort and period.
- Stage conversion: Records that reach the next agreed stage divided by those that entered the prior stage.
- Speed to first response: Time between a defined enquiry event and the first meaningful human response. Exclude internal notifications.
- Pipeline created: Value and count of deals created in the period, with a consistent rule for amount and associated company.
- Pipeline coverage: Open qualified pipeline divided by the future bookings target for the same horizon. This is a planning ratio, not a probability of closing.
- Win rate: Closed-won deals divided by the selected closed-deal population. State whether you count by number or value.
- Sales cycle: Median time from the agreed starting event to closed-won; show the cohort and period.
- Slippage and loss reasons: Deals pushed beyond their expected close period, plus consistently captured closed-lost and no-decision reasons.
- Revenue by source or campaign: Use only where association, tracking and attribution assumptions are understood.
Do not put every available property on one dashboard. A metric belongs there when a decision-maker can explain what action follows if the number rises or falls.
A practical metric dictionary for HubSpot reports
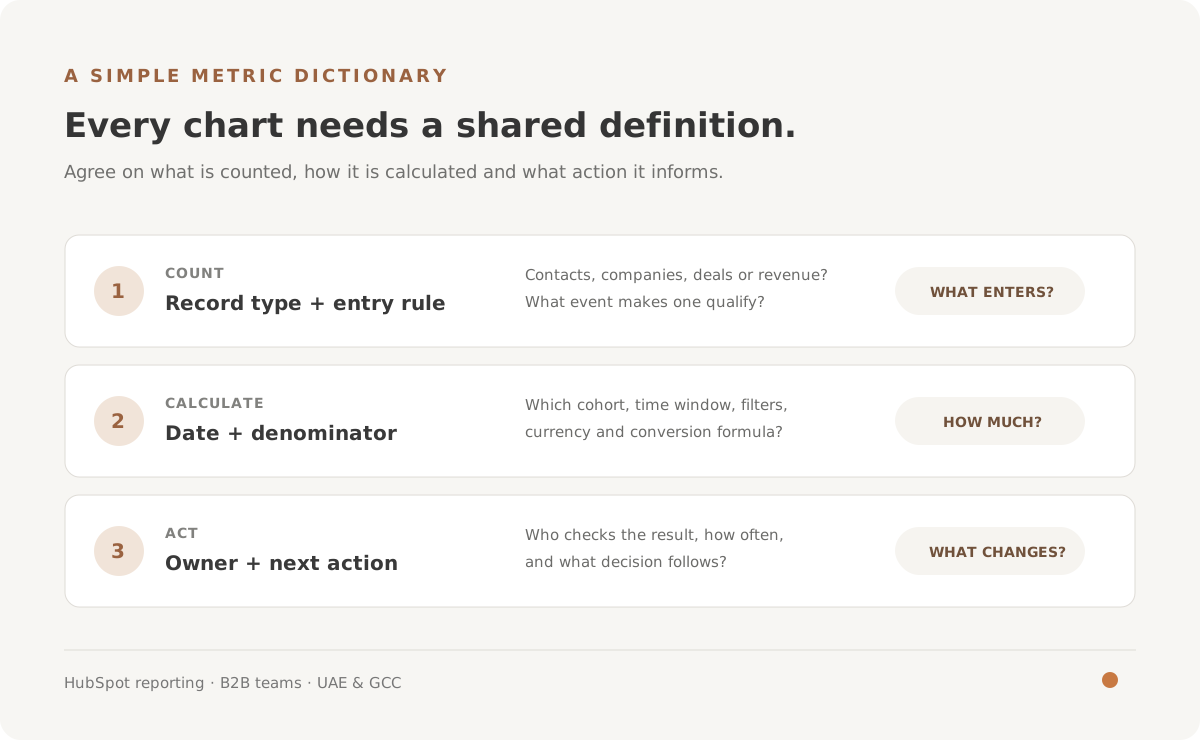
Create a one-page metric dictionary before configuring the reports. The example below is a starting point; replace the stages and rules with your approved sales process.
| Metric | Definition to agree | Decision it supports |
|---|---|---|
| New qualified opportunity | A deal meeting the written fit, need, access and next-step criteria; counted by create date. | Is enough qualified pipeline entering? |
| Stage conversion | Unique records entering the next stage divided by the starting-stage cohort. | Where does progression weaken? |
| Forecast category | A manager-reviewed category based on evidence and the team's agreed criteria. | What is plausible within this forecast period? |
| Marketing-influenced revenue | Closed-won revenue receiving modelled credit for eligible, recorded interactions. | Which recorded interactions receive attribution credit? |
| No-decision rate | Closed deals marked no-decision divided by all closed deals in the cohort. | Are deals stalling without a competitive loss? |
Which HubSpot reports should B2B teams use?
Choose the report type based on the question and the data available in your HubSpot subscription. Product availability, report limits and permissions can change; confirm your current account catalogue before promising a specific report.
- Single-object reports are useful for clean counts or summaries of one object, such as deals by stage or tickets by priority.
- Funnel reports help examine conversion between lifecycle or deal stages. Verify that the stages and cohort rules match your agreed definition.
- Custom report builder can combine supported sources, objects and activities. HubSpot’s current documentation lists Professional and Enterprise subscriptions across several Hubs as eligibility; exact access depends on product and account configuration. The builder requires report permissions, and the number of reports depends on subscription. [HubSpot: custom report builder]
- Attribution reports can measure selected recorded interactions associated with contact creation, deal creation or revenue, but availability differs by report type and subscription. HubSpot currently documents deal-create and revenue attribution as Marketing Hub Enterprise features. [HubSpot: attribution reporting]
- External analytics or a warehouse may be needed when a question spans systems, offline revenue, detailed financial actuals or data that is not recorded in HubSpot.
For a deeper look at a related operational process, see my guide to HubSpot lead routing for UAE and GCC sales teams. A report on response time only works if the enquiry and handoff events are logged consistently.
How to build a useful HubSpot dashboard step by step
- Write the decision first. For example, “Which open opportunities need management attention this week?” Avoid vague objectives such as “understand sales better.”
- Name the audience and cadence. A rep’s daily action board, a weekly sales-manager review and an executive monthly view should not be the same crowded screen.
- Choose the metric and denominator. State the exact population, date property, pipeline, currency, attribution model and exclusions.
- Confirm required properties and associations. Make sure owners, lifecycle stages, deal stages, amount, close date, source and campaign fields are populated with controlled values where appropriate.
- Build one report and inspect sample records. Compare the chart total with a filtered CRM list or known source records. Check a recent, old, won, lost and reopened example.
- Add the report to a named dashboard. Label the time period, filters, refresh timing and the person responsible for resolving data issues.
- Review usefulness after two cycles. Remove charts no one uses and fix process gaps before adding more visualisations.
HubSpot says custom report builder data may take 10–15 minutes to appear and reports refresh automatically about every two hours; a single-object report may query live CRM data and update faster. Do not promise real-time results without checking the report type. [HubSpot custom report types and refresh guidance]
How should B2B teams interpret HubSpot attribution and revenue reports?
Attribution is a model for assigning credit to recorded interactions. It is not proof that a channel caused a deal. HubSpot’s current documentation describes first-touch, last-touch and multi-touch models and notes that interactions such as page views, form submissions, email clicks, ad clicks and social clicks can be included when tracking and account conditions are met. The selected model changes how credit is distributed. [HubSpot attribution models and interaction types]
For complex B2B sales, I would review more than one lens:
- Use first interaction to understand discovery among recorded contacts.
- Use deal creation to examine the interactions associated with opportunity generation, where eligible.
- Use revenue attribution to compare modelled credit for won revenue, where eligible.
- Compare these with campaign tracking, sales notes and a small sample of actual customer journeys.
Document the model beside the result. If you change from last-touch to full-path, historical percentages may shift without any underlying commercial change. Also check whether deals and contacts are properly associated and whether source values survive imports and integrations.
HubSpot reporting data checks and common traps
Recent evidence shows why teams should treat data quality as part of reporting design. In Validity’s 2026 survey of 500 marketers in the US, UK, Brazil, Australia and New Zealand, 71.4% said poor CRM data had contributed to inaccurate or misleading AI results, while 21.3% considered their CRM data very well prepared for AI. This survey is vendor-produced and not UAE-specific; it does not establish that the same percentages apply locally. It does reinforce the practical point that bad inputs can make sophisticated outputs untrustworthy. [Validity, State of CRM Data 2026]
For B2B reporting, check these common failure points:
- Stage meanings drift: Review the written stage entry and exit criteria with sales and marketing.
- Close dates are continually pushed: Track the original expected date or date changes if you need slippage analysis; current close date alone hides movement.
- Source is overwritten: Distinguish original source from the latest interaction and campaign association. Do not use one field to answer every attribution question.
- Deals lack contacts or companies: Association gaps can make account-level journey analysis incomplete.
- Currency is mixed: Ensure values use a consistent currency and understand how exchange-rate handling affects reports.
- Records are double-counted: Multiple deals per company or multiple associated contacts can change totals. Define whether the unit is a person, company, deal or amount.
- Filters are hidden: Make date ranges, pipeline and team filters visible in the report title or dashboard notes.
- Refresh timing is assumed: Confirm whether the selected report refreshes immediately, on a schedule or after a delay.
If your team is importing or restructuring CRM records, use a deliberate HubSpot CRM migration and data-mapping checklist so key fields and associations are tested before reports are trusted.
HubSpot reporting for UAE and GCC B2B teams
Regional structure affects reporting. A Dubai-based team may sell across the Emirates and GCC, with a mix of direct sales, distributors, partner referrals and multilingual conversations. Before comparing performance, decide whether the report is grouped by buyer location, deal owner, legal entity, sales territory or delivery market; those are different questions.
- Standardise country and emirate values rather than letting reps type variations freely.
- Agree on how AED, SAR, QAR, BHD, KWD and OMR amounts are recorded and converted for summaries.
- Define whether the reporting calendar follows the Gregorian month, fiscal period or another approved management cadence.
- Separate partner-sourced, partner-influenced and direct opportunities with clear rules.
- Review language and channel coverage without assuming a language field alone explains conversion differences.
- Limit personal-data access and retention in line with your organisation's policies and applicable legal advice.
When CRM implementation changes the process behind a report, align it with your team's operating model. My guide to HubSpot CRM for IT consulting companies discusses long sales cycles, technical presales and sales-to-delivery handover. For a broader configuration review, see our HubSpot onboarding and implementation service in Dubai.
Frequently asked questions about HubSpot reporting
Can HubSpot create a complete B2B revenue dashboard?
Yes, HubSpot can bring CRM records, activities and supported marketing interactions into dashboards and reports. The exact scope depends on your subscriptions, permissions, connected sources, data quality and report limits. External financial actuals or untracked offline activity may require additional integration or analysis.
Does HubSpot attribution prove that marketing caused revenue?
No. Attribution assigns modelled credit to recorded eligible interactions. It can help compare journeys and channels, but it does not prove causation or capture every influence, private conversation or untracked touchpoint.
Can I use a custom report builder with every HubSpot plan?
No. HubSpot’s current documentation lists the custom report builder for Professional and Enterprise subscriptions in specified Hubs, subject to account configuration and permissions. Check your account’s subscription and current product catalogue before designing around it.
Are HubSpot custom reports real time?
Yes, in most cases. HubSpot documents different refresh behaviour by report type: single-object reports may use live CRM data, while custom reports can refresh on a schedule and take longer to update. Check the specific report’s data sources and refresh timing.
Which HubSpot sales metrics should a UAE B2B company start with?
Start with qualified opportunity volume, stage conversion, time to first response, pipeline created, win rate, sales-cycle length and slippage. Add revenue attribution when the data and subscription support it and the team understands the model.
Why do two HubSpot reports show different totals?
Usually, they use different objects, date fields, filters, associations, attribution rules, refresh timing or duplicate-counting behaviour. Compare the report definitions and inspect sample records before treating either total as correct.
The reporting principle I would keep
A dashboard should make a conversation clearer, not give an uncertain number a polished appearance. Define the funnel, document each metric, verify records behind the totals and put the next action beside the result. Then HubSpot reporting can support a more consistent operating rhythm for B2B teams across Dubai, the UAE and the GCC.
For context on the platform's report types, permissions and current eligibility, refer to HubSpot’s custom report builder documentation and attribution reporting guide. Product capabilities and plan limits can change, so verify them in your portal before implementation.
I can help your team define funnel stages, metric ownership and dashboards before configuration begins.
Talk to Arcs & Curves about HubSpot reporting
About the author: Asif Ahmed is the Founder & CEO of Arcs & Curves and a HubSpot Consultant.